Graphical Representation to Track the Progress of a Task
Burn Down Chart is an useful graphical tool to track and monitor progress. The Task Burn Down Chart indicates the tasks that are remaining versus the timeline. It can be used to forecast the completion of a project. The graphical representation in the chart helps you to track the progress of the tasks.
The tasks that are remaining are displayed on the vertical axis. The date range is shown on the horizontal axis.
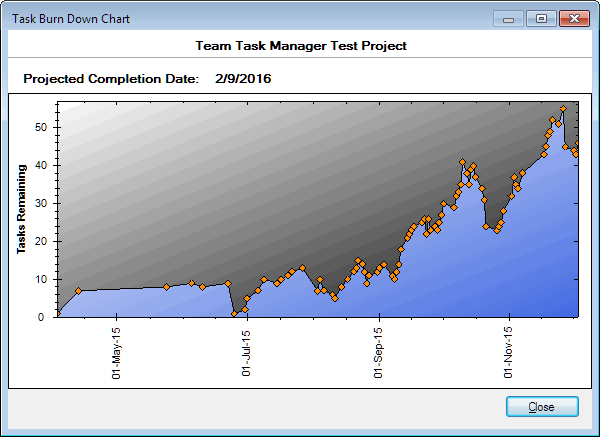
The Task Burn Down Chart is shown as a graphical line from the start date till the completion date of a project or task group. If the project or task group is not completed, then the graph will represent the tasks that are remaining till the present day. In the Chart, you can view how many tasks are remaining in a particular project or task group.
Double-clicking on the Task Burn Down Chart opens it in a new window. The Projected Completion Date predicts when the project or task group will be completed. For example, assume that a project has 20 tasks that are to be completed within 30 days, say from January 1 – 30, 2010. If 10 tasks are completed by the January 20, 2010 then the Average Task Completion rate is 0.5 task per day. According to this calculation, the remaining tasks will completed within 20 days from January 20, 2010. Hence, the Projected Completion Date for the project or task group will be February 09, 2010.
Note: The Projected Completion Date is not visible for a completed project or task group and also where none of the tasks are complete.
By right-clicking on the chart, you are provided with a list of options. You can Copy the image to the clipboard and paste it in a word file or image file. The Save Image As allows you to easily save the chart in an *.emf, *.png, *.gif, *.jpg, *.tif and *. bmp image format. You also have the option to take a print of the Chart.
|