Understanding the Gantt Chart
The Gantt Chart shows Projects, the Task Groups within a project and various tasks as horizontal bars called time item. Using the Gantt chart you can see at a glance the start date, due date and duration of tasks. The length of the bar represents the duration of the activity.
Information such as the start date, due date and percent complete is shown when you hover the mouse over a Project, Task Group or Task. You can also add, edit or remove a Task Dependency from the Gantt Chart. Refer to the image given below to see the various time items and important components of the Gantt Chart.
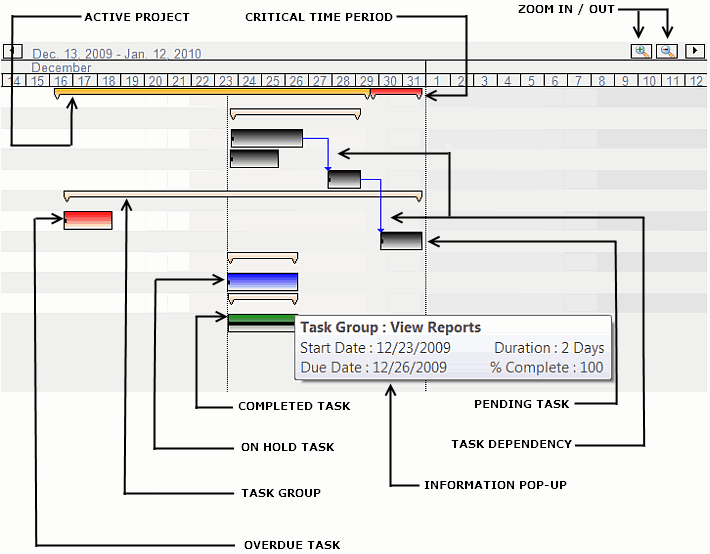
When tasks in a project do not get completed within the due date of the project, a Critical Time Period gets added to the project. This time period represents the extra time taken to complete the project.
The scroll bar below the chart or the left and right arrow buttons above the chart can be used to scroll it. The Zoom In and Zoom Out feature can be used to expand or narrow the date scale.
Click on a Task, Project or Task Group on the Task List to see the corresponding Gantt Chart time item for it. A task that is complete and appears green in the Task List will be represented by a green rectangle, a red box signifies an overdue task etc. Double-clicking on any time item in the chart displays the Edit dialog for that time item.
To print the Gantt chart or save it as an image, open the Edit menu and select Copy Gantt Chart.
Cursors
The mouse pointer changes depending on its position in the Gantt chart to let you know the operations you can perform at that time.
| Pointer |
Functions |
 |
Appears when you drag the time item for a task. You can shift the time item left or right on the date scale. This changes the start and due date without changing the duration. |
 |
Appears when you position the cursor over the end of the black horizontal line inside the time item for a task. Increase/decrease the length of the line to change the percentage completed. |
 |
Appears when you position the cursor at the start or end of the time item for a project/task. Their start or end date can be changed by dragging the cursor. The duration also changes as a result of this. |
Legend
The color of the horizontal bar is an indicator of the current status of the task. Legend can be seen in the status bar and it informs you what each color bar stands for. You have the option of choosing different colors for Pending, Overdue, On Hold and Completed tasks.
For color customization, in the toolbar click on Settings >> Display >> Status Color Preferences. You can customize the color for each status type by clicking on the color to open the Color dialog. You can opt for Basic colors or Custom colors. After selecting the color, click on OK to apply the change. To revert to default color, click on Restore Defaults.
|